I measured 13,641 alerts against 409 million candles in one afternoon
23 October 2026
The alerts are there to tell you when something happened, and nothing at all about what happened next.
So I measured 13,641 of my own alerts against two years of one minute price history to find out.
An actual answer to an actual question, and then the setup that produced it, so you can go and ask your own. It took three things and an afternoon, and you can have all three.
The question I picked is the simplest one there is. When one of my spike alerts fires, what does price do next?
Before I give you the numbers, one thing. Neither of these feeds is a signal and I've never sold them as one. What they are is a shortlist of valid setups showing the characteristics of the type of price action that represents a type of trade, and the point of this piece is that you can check that claim yourself rather than take my word for it.
The answer first
I measured 2,717 spike alerts. Every one of them anchored on the minute the spike printed, then price checked 15, 30 and 60 minutes later.
An hour after the alert the median move is 1.76 per cent against the spike. Only 39.5 per cent of them are still going the same way.
So they snap back more often than they carry on. Bigger ones snap back harder. Above 12 per cent the median hour is 3.23 per cent against.
Then the number that stops you doing anything clever with that. The median best case, if you'd sat in the direction of the spike for the hour, is 4.9 per cent in your favour at some point. The median worst case is 5.47 per cent against you at some point. Both. On the same trades.
That's the problem though. There's a fade tilt in the closing price and the path to it is violent in both directions, so the tilt is not a trade, it's a starting point.
The same test on the other feed
I ran it on the staircase alerts too. 10,924 of those.
Completely different shape. An hour after a staircase alert the median move is 0.12 per cent against, and 46.5 per cent continue. Median best case 1.45 per cent, median worst case 1.54 per cent. Longs and shorts behave the same as each other.
That's as close to nothing as a number gets. The staircase alert, on its own, with no context, tells you almost nothing about the next hour.
What you need to run it yourself
Three things. Most people stall because they only have the first one.
1. The alerts. Every alert my bots send to Discord is also written to cloud storage as one small JSON file. Six fields for the spike feed: symbol, direction, how big the spike was, the minute it printed on, when the alert went out, and a schema version. You list the files and you fetch the ones you want. There's no API to learn, it's just URLs.
2. Candles. This is the bit people miss. An alert is a timestamp, and measuring what came after it needs price history. I've got a database of 524 Binance perps, one minute bars, about two years deep, roughly 409 million rows and about 6 GB. It installs locally and tops itself up from Binance's free API every night.
3. A measurement rule you write down before you look. Mine for this was one sentence: anchor on the close of the spike bar, measure the close 15, 30 and 60 minutes later, flip the sign on the down spikes so positive always means it continued. That's it. Writing it down first is what stops you sliding into “well, what if I measured it from here instead” once you've seen the answer.
The actual work after that is less than an evening. I describe what I want and Claude writes the scripts for me.
Check one by hand before you believe any of it
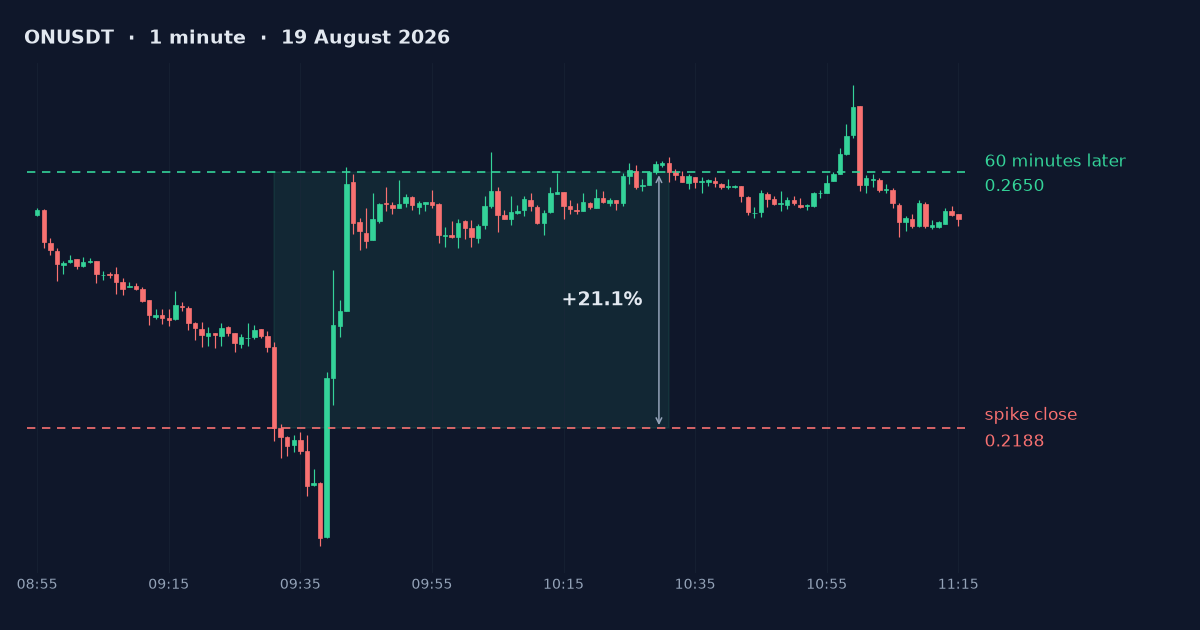
The first real trade I looked at was ONUSDT on the 19th of August. A 9.2 per cent spike down at 09:31. An hour later it was 21 per cent higher than where the spike closed.
I pulled the raw candles for that hour and worked the numbers out by hand to make sure the script agreed with the chart. It did.
That's the only step in this whole process I'd call non negotiable. Pick one alert, open the chart, and check the script is describing the same event you can see with your eyes. Summaries and averages hide bugs brilliantly. A single trade on a chart doesn't.
What I'd actually go and ask
The measurement above is deliberately dull, because the dull one has to work before anything else does. Things I think are more interesting, and haven't done:
Does the fade tilt survive if you only take spikes on coins with real volume behind them.
Does it change by time of day, or by whether the whole market was moving at the same time.
Does a staircase alert mean more when the alert before it on the same coin was also a staircase.
Whether any of it holds in the last three months, having been measured on the last five.
I genuinely don't know the answers but it might be fun finding out!
If you want the data
Both feeds are read only, and the candle database comes with it.
DM me the word data. I'll send back a read only token, the guide, and the script that keeps the candle database up to date.
Or skip the message. The candle database, the access link and the setup prompt are all on the data page.
Detection tooling, not financial advice. Nothing here implies or promises performance.