Claude wrote the backtest and I found two lookahead bugs in it in two days
30 October 2026
Rule number 1, if a backtest comes back too good to be true, it usually is until I've proved otherwise.
I'm a developer who has been trading for 4 years.
I had to find this out the hard way but it's the most expensive thing I've learned, and I learned it twice in two days.
How these actually get built
I describe the strategy and Claude writes the simulation, the validation and the charts.
That's the only way I can possibly process this amount of data so quickly. What used to be a month of work is now an evening.
It also means the thing doing the work and the thing checking it are the same. That is exactly where this goes wrong.
What too good looks like
When I am backtesting I prefer to try and prove something doesn't work rather than trying to prove that it does.
So I've got a short list of things that mean I should stop and pay attention:
- A win rate that doesn't fit the reward to risk.
- A drawdown that's trivially small next to the total return.
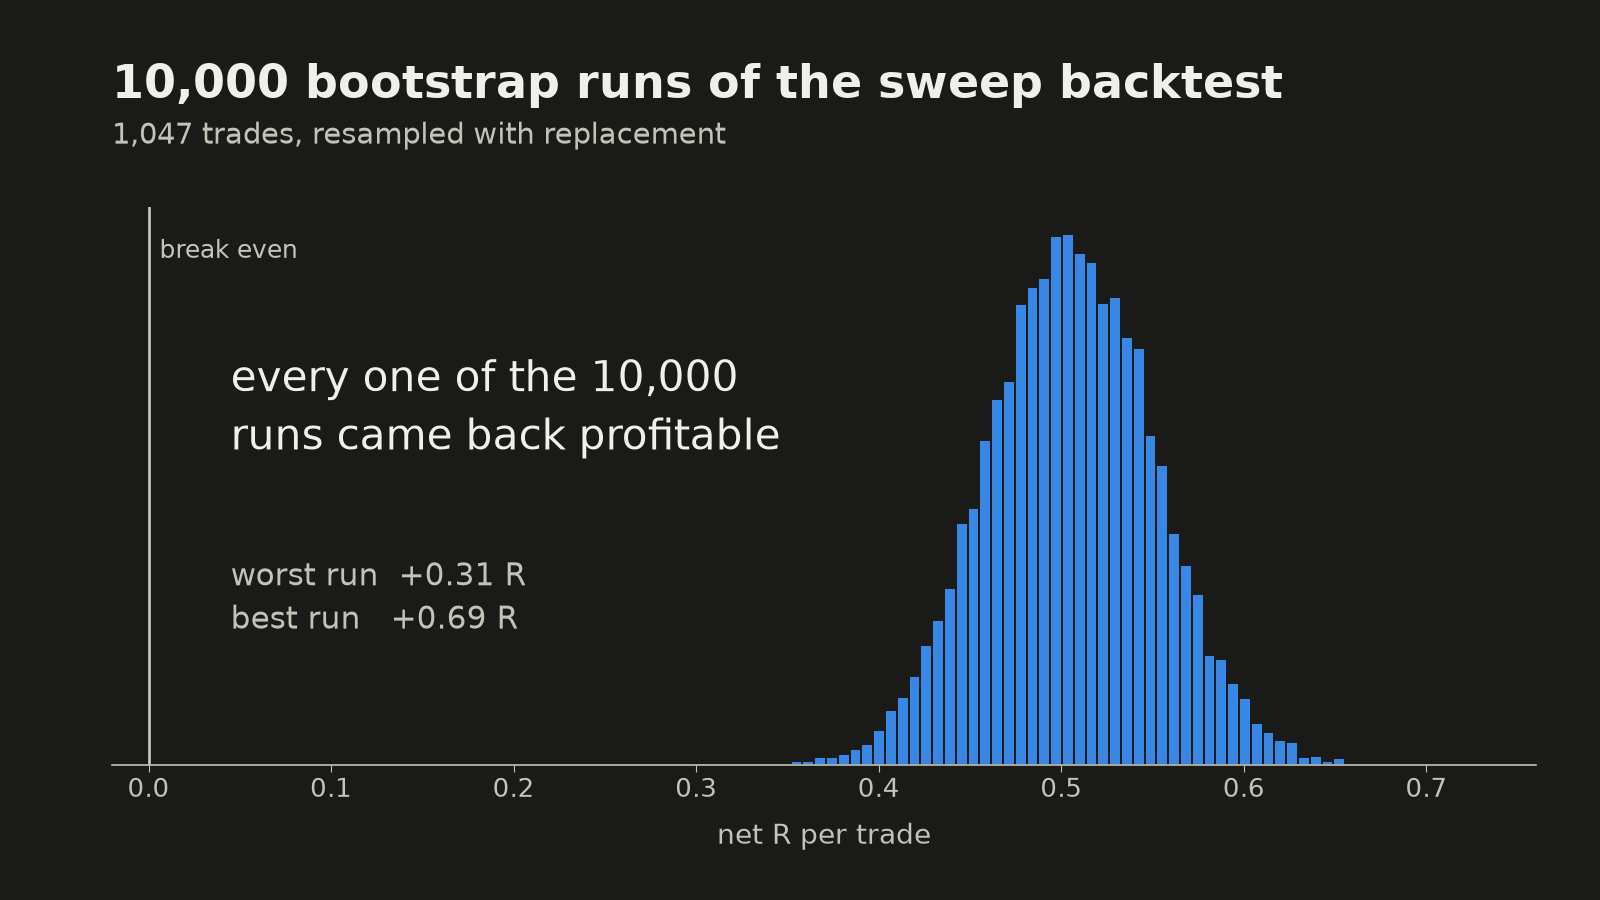
- Any simulation of random reorderings that comes back profitable every single time.
- And any measure of how much of the return is signal rather than noise that comes back enormous.
None of those prove a bug. They just mean the odds of a bug are now higher than the odds of an edge.
A systematic tradeable edge almost never looks exciting.
The first time
Last August I had a strategy fading one hour sweeps. A sweep is where price pokes through a level, takes out the orders sitting above it, and comes back.
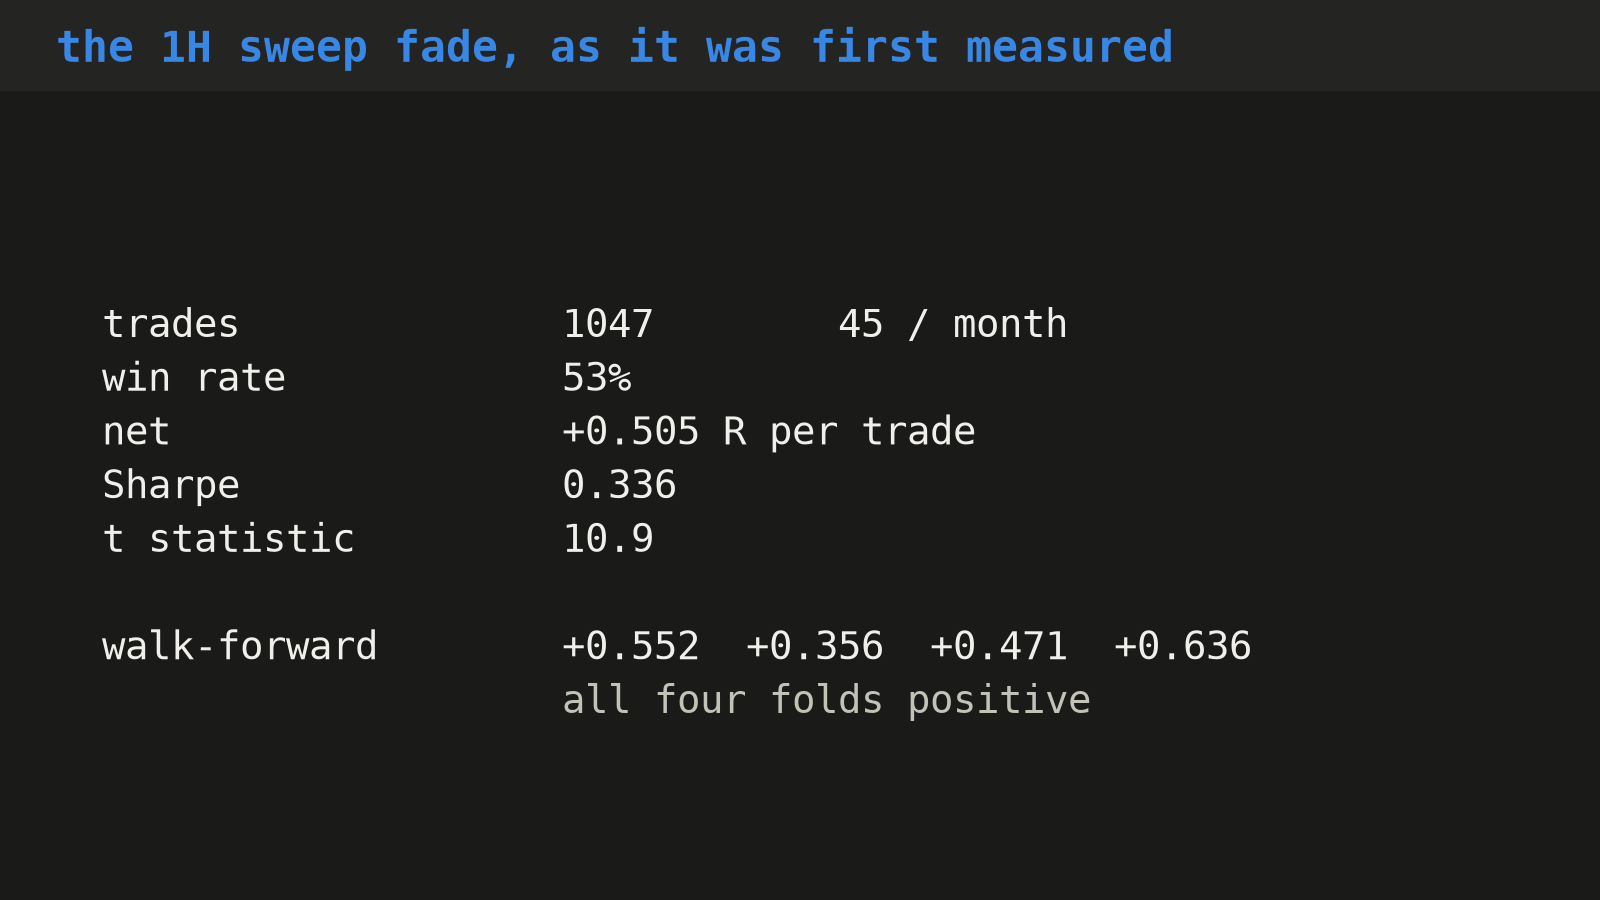
The numbers were ridiculous. Positive expectancy, 53 per cent win rate, and a great t statistic of about 11, which is a measure of how confident you can be that a result isn't luck. Eleven is not a number related to trading as such, it's a physics number.
It also passed everything we threw at it. Walk forward, which basically means training on one stretch of history and testing on the next. A Monte Carlo simulation, which reshuffles the trades thousands of times to see if the order mattered, and which came back profitable in essentially every run. And a formal statistical test designed to catch exactly this kind of false positive, which it sailed through.
There was a locked build configuration written up and I was ready to go.
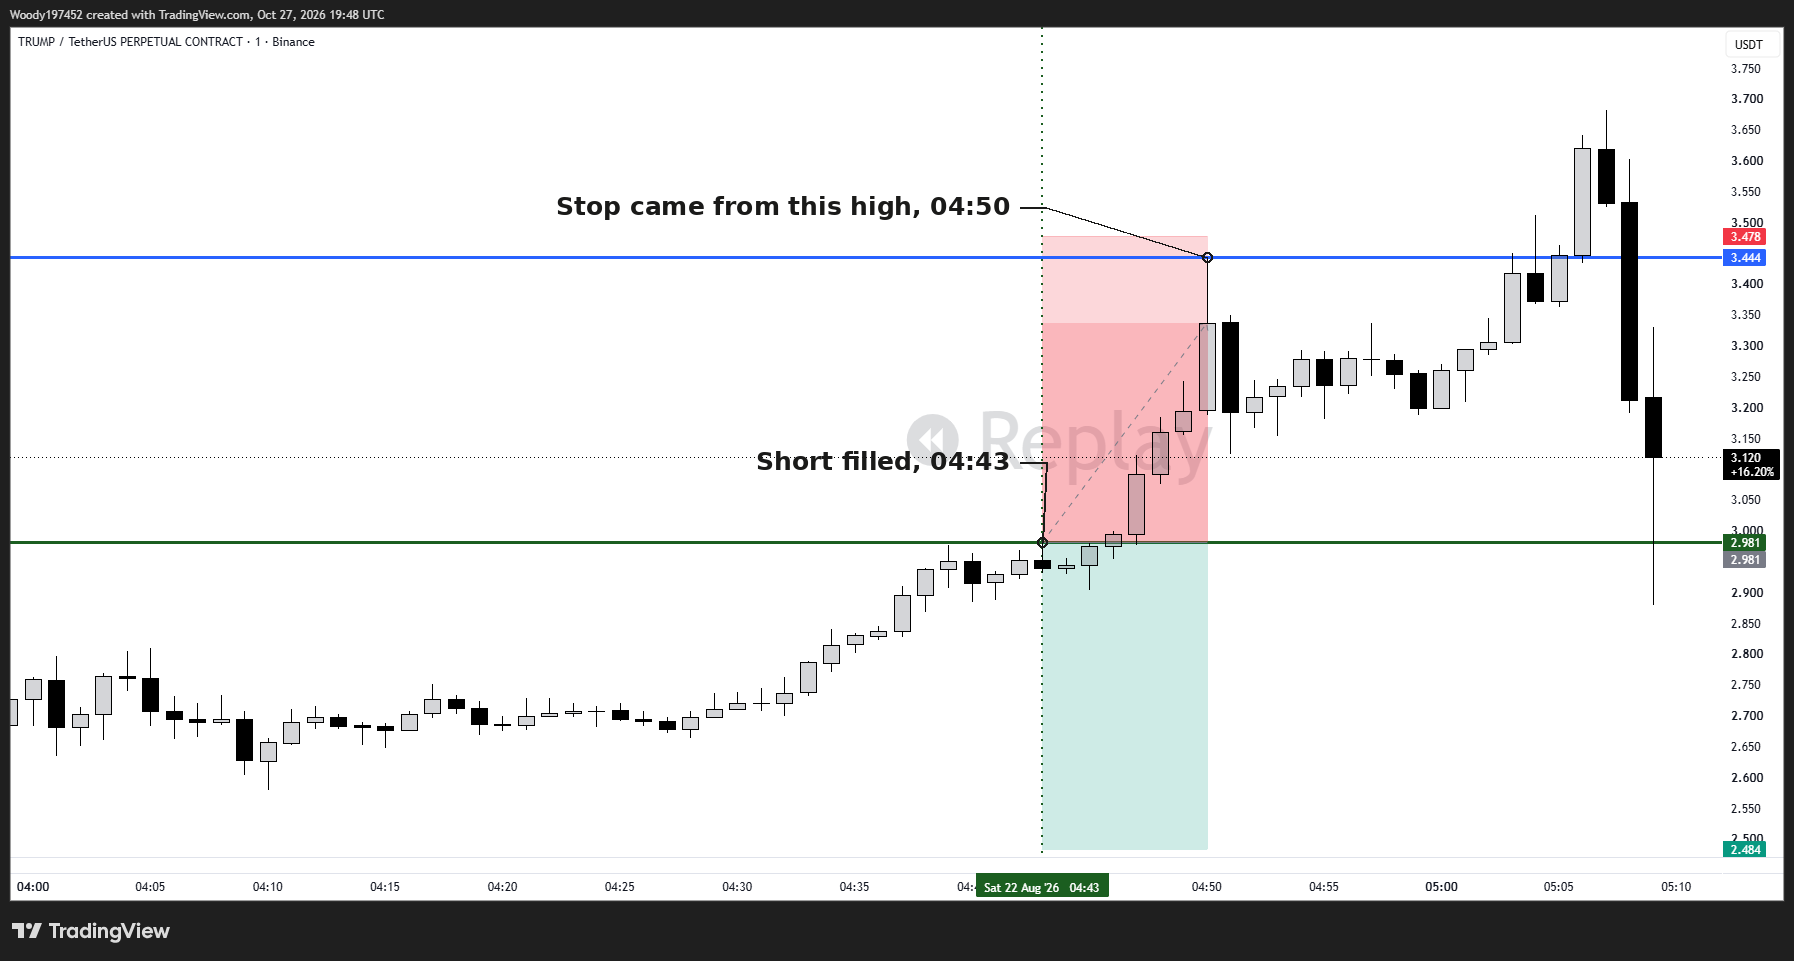
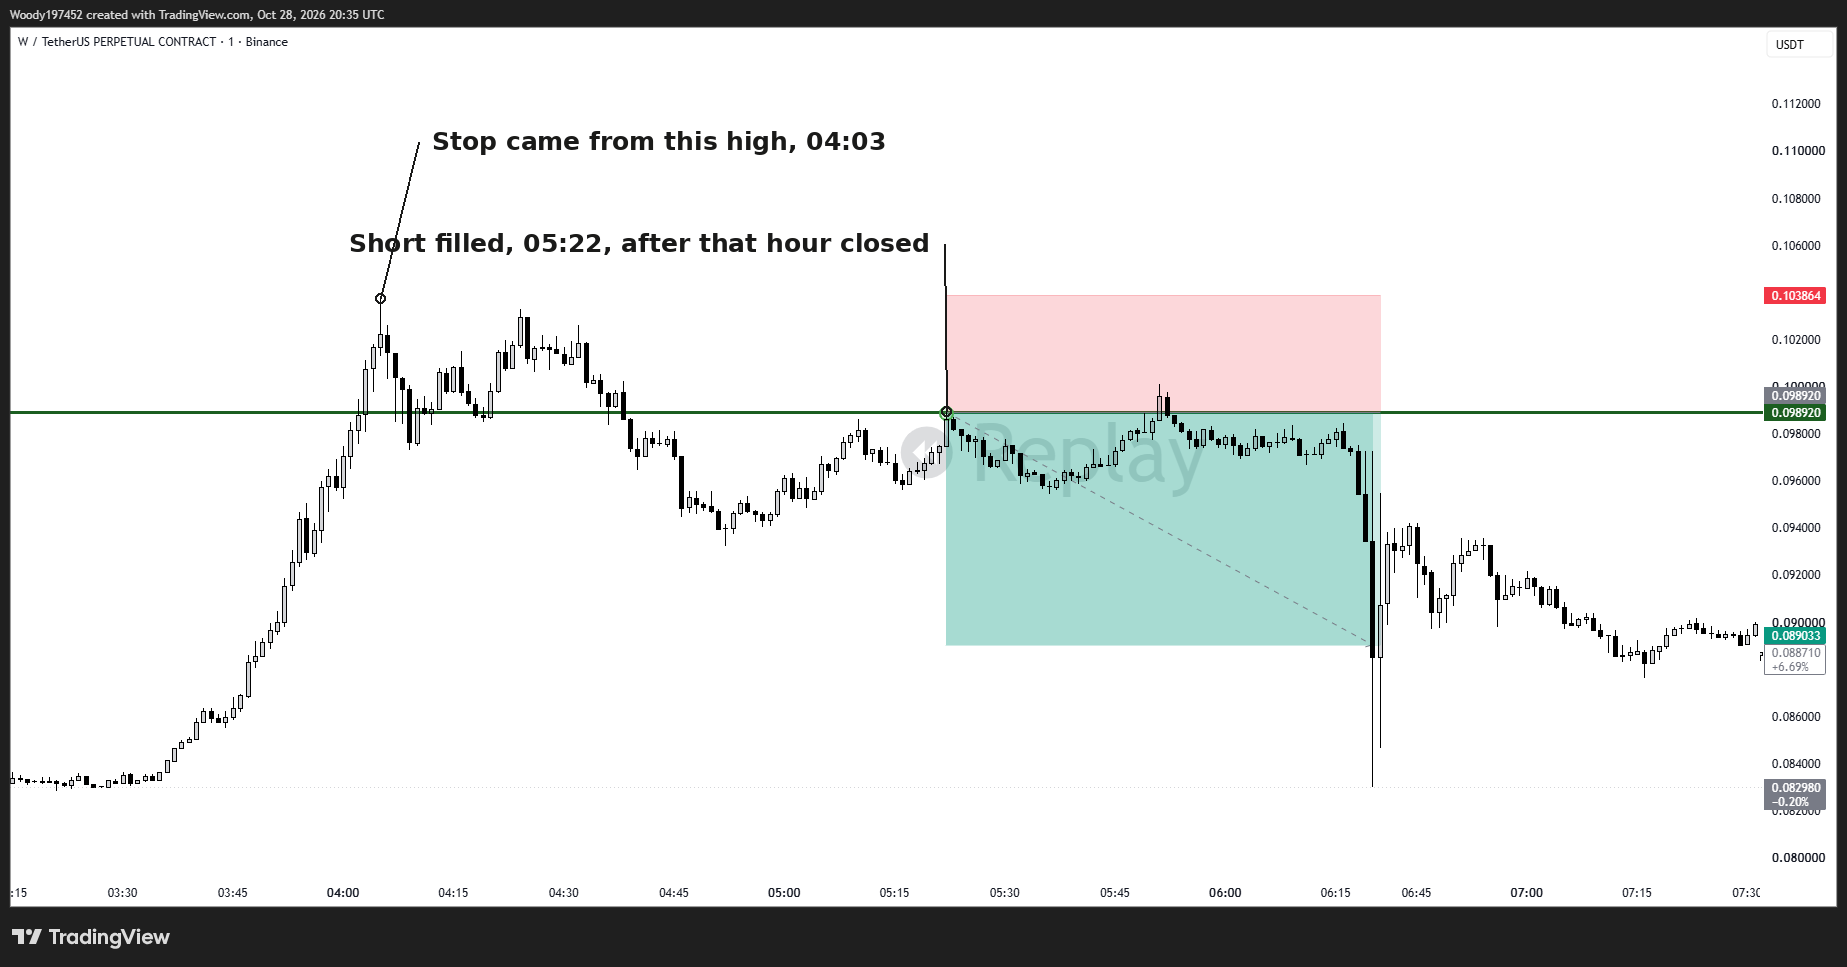
Then I charted one trade manually. TRUMP, the 22nd of August.
The entry was at 04:43. The high the stop was based on printed at 04:50.
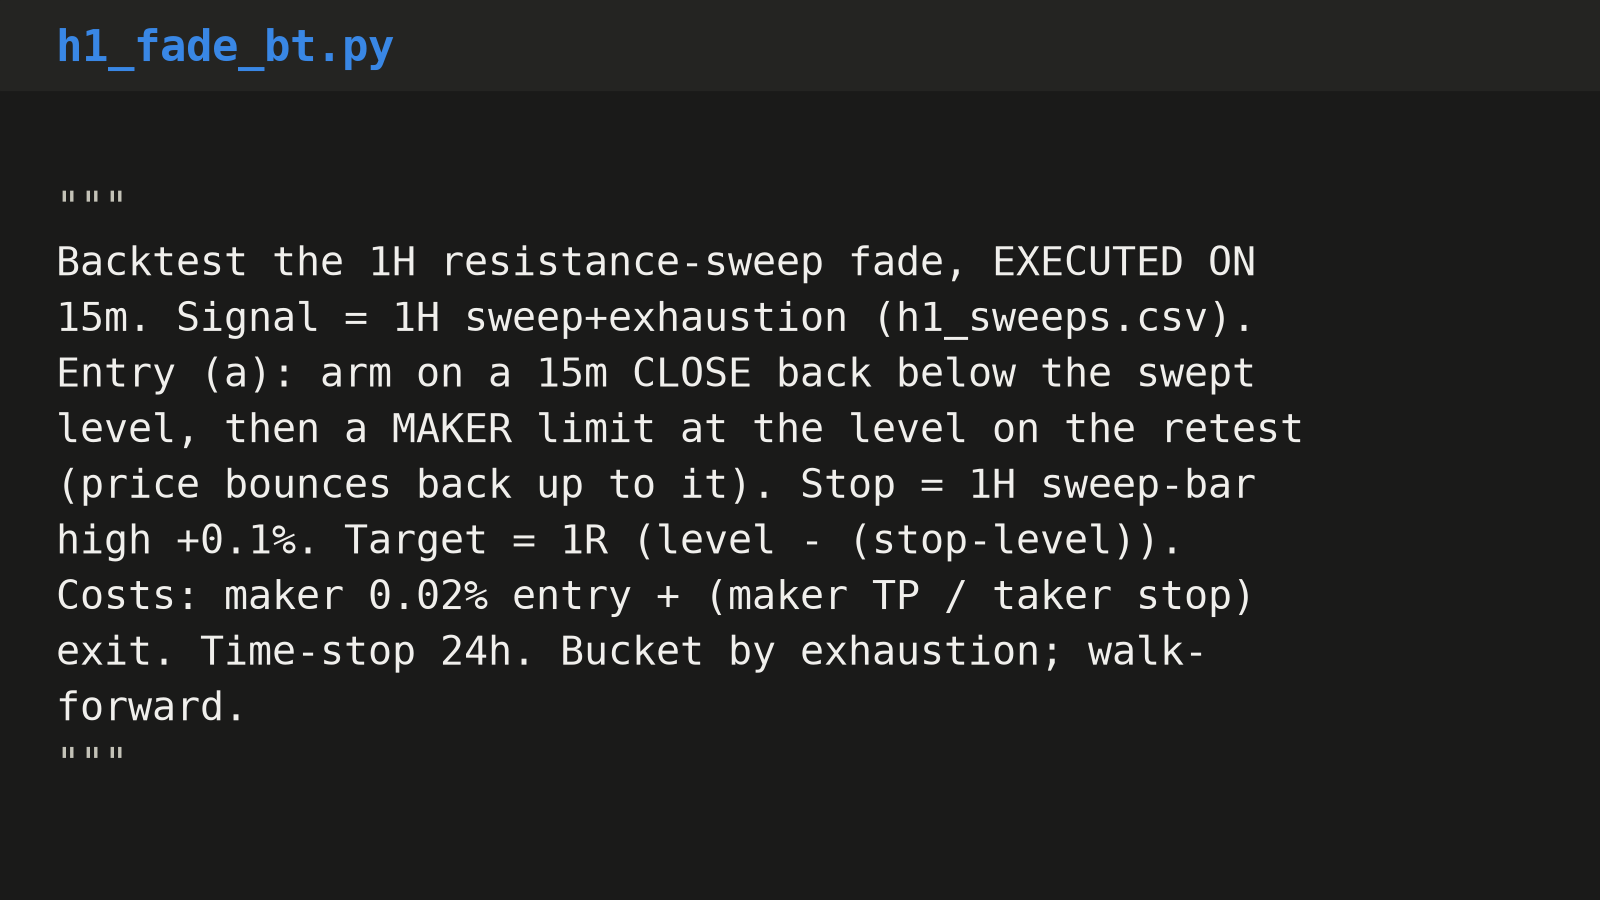
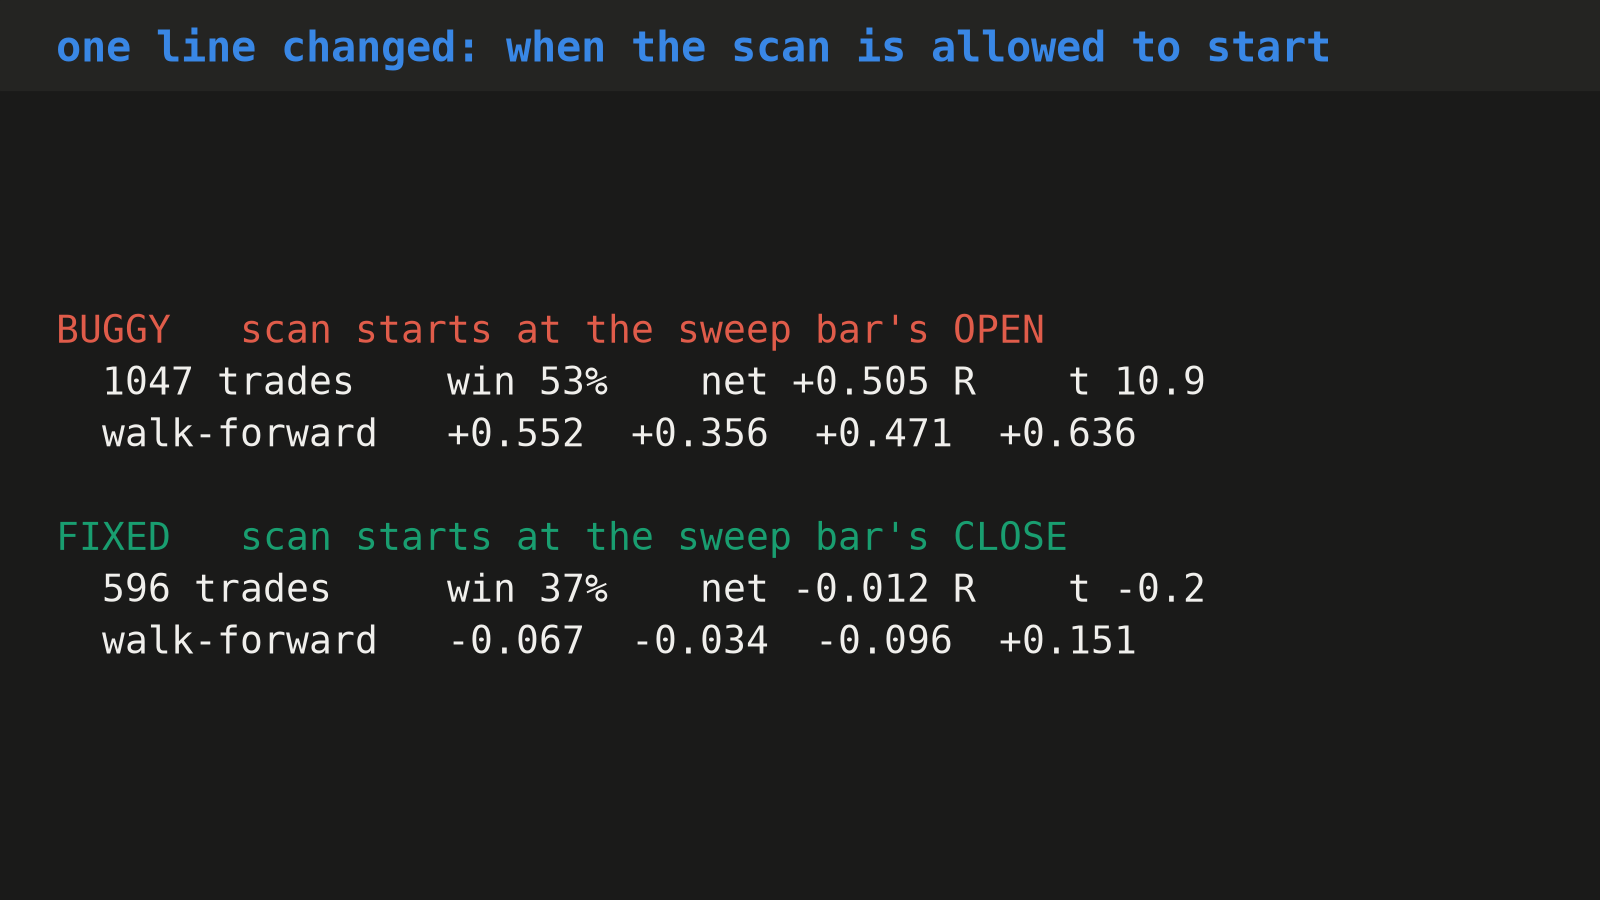
The simulation started scanning at the sweep bar's open rather than waiting for it to close. So it was filling shorts on the way into the sweep, before the bar's high existed, and then setting the stop from a price that hadn't happened yet.
Once fixed, the same strategy came back at minus 0.012 times risk per trade, 37 per cent win rate, three of four test periods negative, and half as many trades. There was no edge. There had never been an edge.
Every one of those validation tests was void.
The second time
The day before, a different strategy, same shape of mistake.
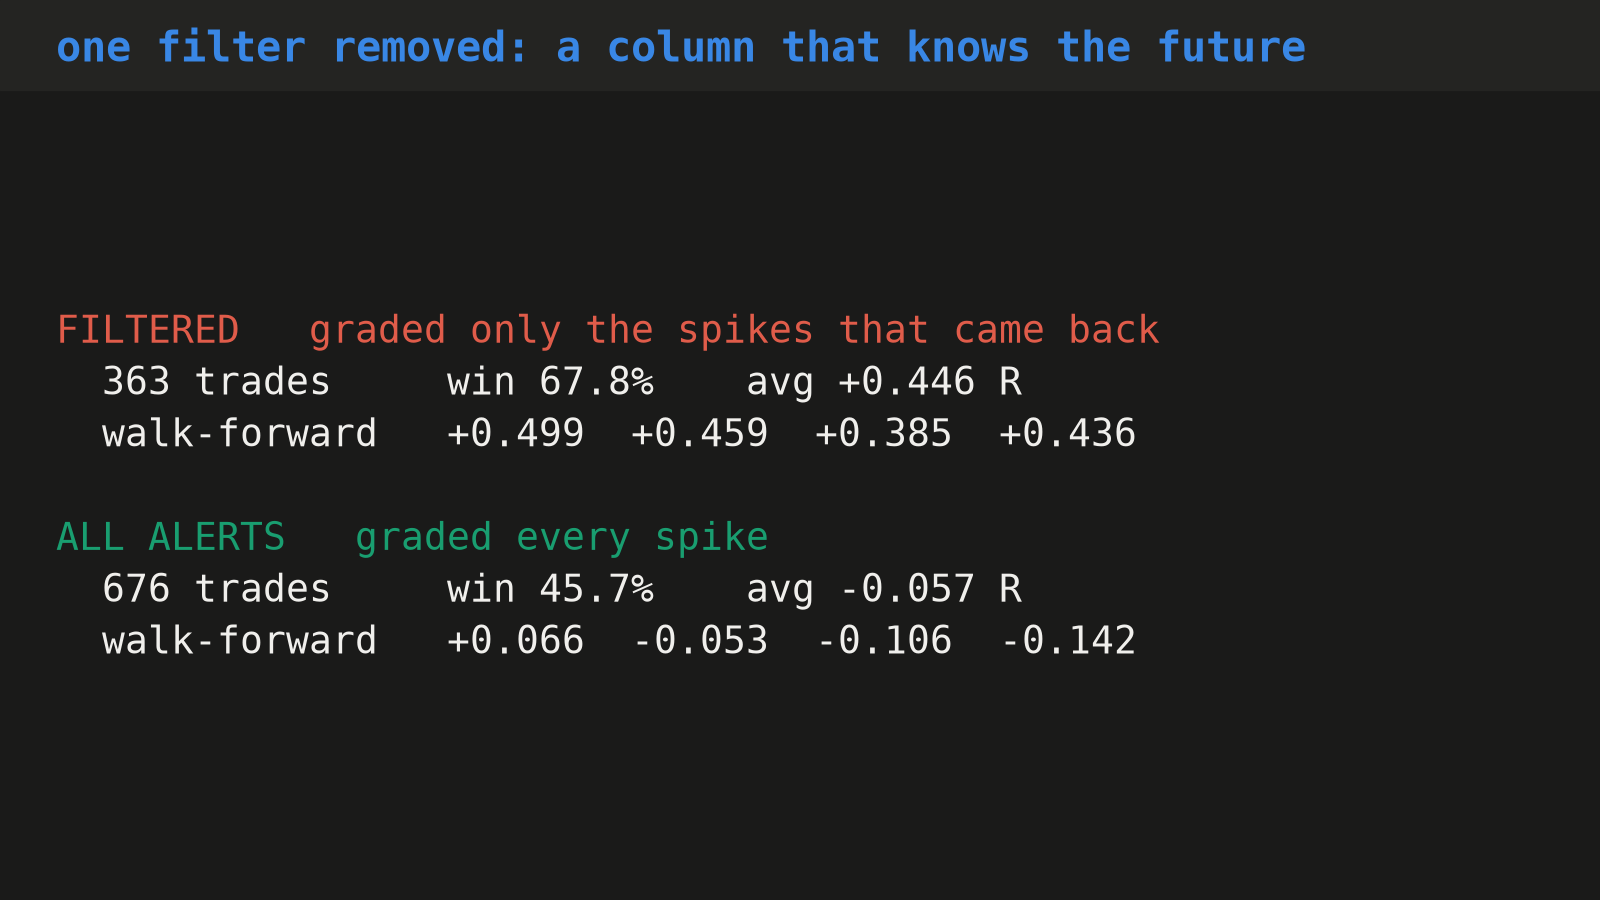
The engine filtered its input on a column that recorded how long price took to return to where a spike started, and left blank if it never did. That's a fact about the future. Filtering on it meant only ever grading the roughly half of spikes that came back, which is to say grading the winners and ignoring the rest.
Dashboard said 363 trades, 67.8 per cent win rate, plus 0.446 times risk per trade.
Toggle that one line and it goes to minus 0.057 on 676 trades, with three of the four test periods negative. Replaying the actual live settings honestly gives minus 0.02 gross and minus 0.10 after costs.
Why none of the tests caught it
All those validation tests ran on the contaminated data.
The Monte Carlo reshuffles the trades. If the trades themselves were selected using the future, reshuffling them tells you nothing. The walk forward splits the history into periods. If every period is built from the same bad filter, all the periods agree, and they agree because they're all wrong in the same direction.
The contamination sat upstream of everything the statistics looked at. So the statistics confirm it rather than catch it.
That's why longer validation is not the answer. We had a long validation battery and it passed.
And it isn't that nobody noticed. Claude flagged those numbers as suspicious three separate times on the sweep strategy. Each time it reasoned its way back round to them, and so did I. In sample optimism, small sample, that sort of thing. Flagging it up was right and the thinking after was just wrong.
The check that does work
Chart a real trade.
Not a summary, not an equity curve. One actual trade on actual candles, and verify if this was a real trade that would have been executed, does the entry make sense, is the level, stop and TP correct. Was every number used, the entry, the stop, the target, the filter, knowable at that moment. Does everything look as you would expect it to basically.
Both bugs took about an evening to find once I had looked at a chart instead of a table.
I now do three trades minimum, picked deliberately. A winner, a loser, and the biggest winner in the sample, because if there's lookahead anywhere it'll be living in the biggest winner.
Claude writes the simulation, I look at the trades to verify. Not because I'm better at the statistics, I'm definitely not. It's because looking at one trade on a chart is the only check that doesn't share the simulation's own assumptions.
The list
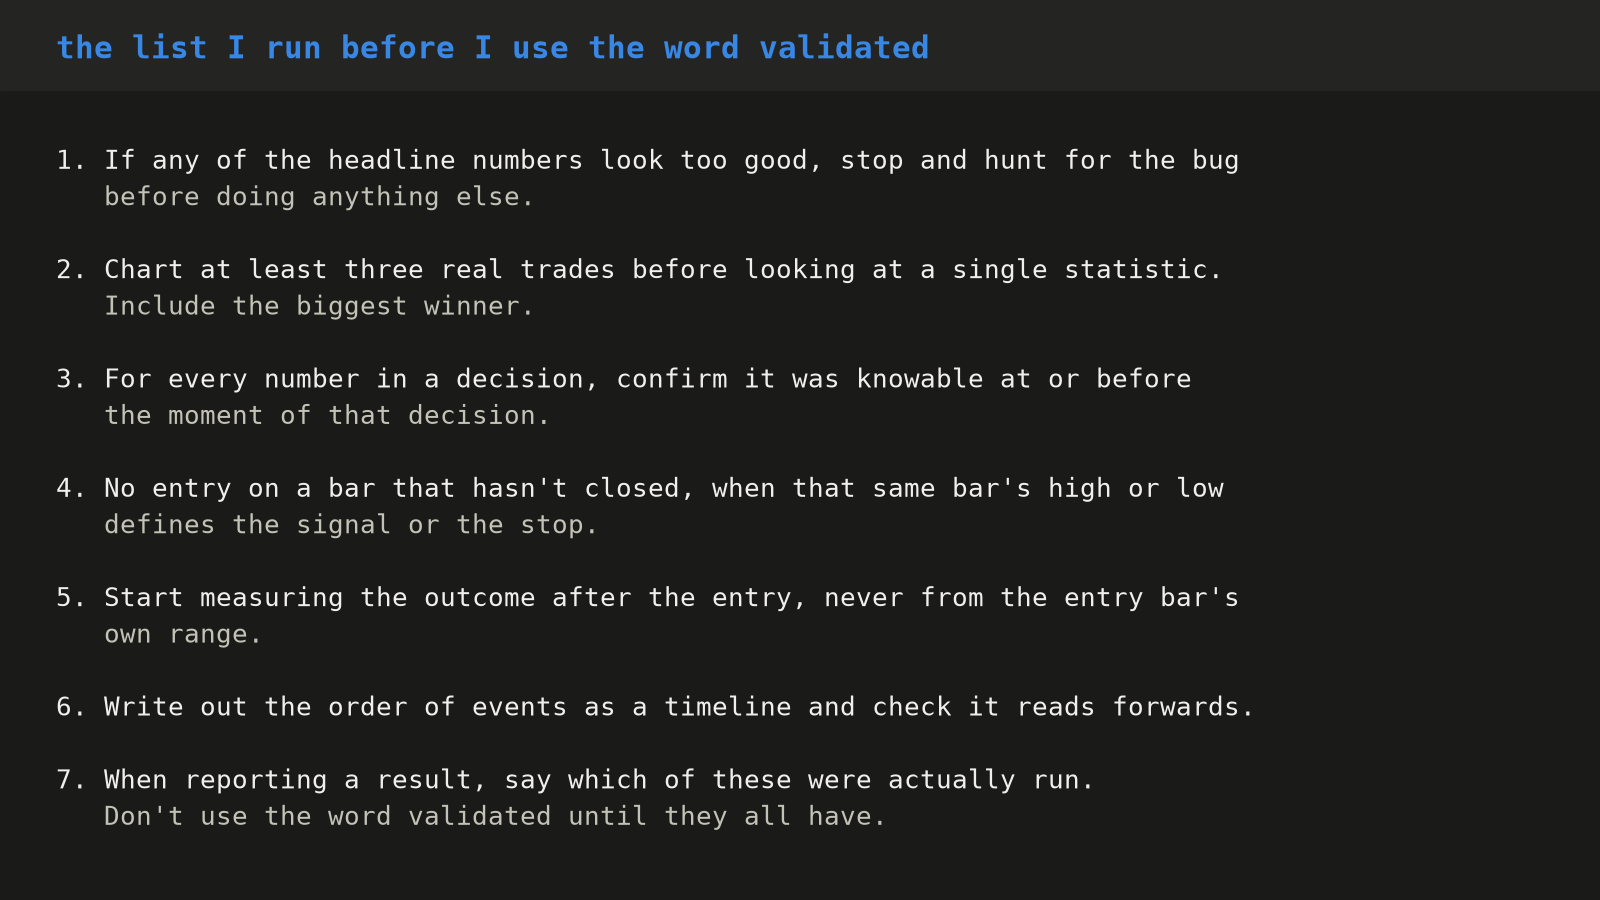
- If any of the headline numbers look too good, stop and hunt for the bug before doing anything else.
- Chart at least three real trades before looking at a single statistic. Include the biggest winner.
- For every number in a decision, confirm it was knowable at or before the moment of that decision.
- No entry on a bar that hasn't closed, when that same bar's high or low defines the signal or the stop.
- Start measuring the outcome after the entry, never from the entry bar's own range.
- Write out the order of events as a timeline and check it reads forwards.
- When reporting a result, say which of these were actually run. Don't use the word validated until they all have.
The reason that's a written list rather than a habit is that the warning signs got talked away three separate times on the sweep strategy before anyone charted anything. Knowing the rule isn't the same as running it.
Run your own
The candle database, the alert feeds and the setup prompt are on the data page.
Detection tooling, not financial advice. Nothing here implies or promises performance.